READINESS IS A PRACTICE. START HERE.INDEPENDENT PREPAREDNESS // EST. 2026

THE WORLD, IN VIEW

Global wildfire & heat map

Explore conditions. Understand your world. Get prepared.

Find local conditions ↗

Used for this page only. We do not save your ZIP code. How lookup works

Or choose a public place
GLOBAL CONDITIONS

Wind currents

Scroll or pinch to explore cities and streets.

Click the globe to inspect a location.

Flow follows surface wind. Globe rotation is illustrative.

Loading public weather data…

Source ↗
About this view Wind currents

Colours show wind speed. Trails follow the forecast wind direction.

Global patterns, not an address-level forecast. Blank areas mean missing data. Check official local warnings for immediate decisions.

Use the map keyboard controls, zoom buttons or preset places. Map selections are not saved.

NOAA · NASA · USGS. Source times are shown; observations and models have different update schedules. Earthquake reports may be revised and small events are not comprehensively reported worldwide.

Sources, open-source software & how motion works

This globe uses MapLibre GL JS and OpenFreeMap maps from OpenStreetMap. Zoom in for cities, roads and neighborhoods. Map detail increases with zoom; weather retains its original global resolution. Atmospheric trails show surface wind; ocean trails show geostrophic currents. Rotation is a browsing effect, not a forecast animation. Quake pulses mark reported epicentres, not seismic-wave travel. Fire markers use NASA FIRMS Suomi-NPP VIIRS satellite heat detections, with clustering at global zoom and an observation replay. Flame icons are illustrative markers, not live footage or a simulation of fire spread.

Licences & full data credits · USGS feed documentation · NASA FIRMS downloads · Official local warnings

UNDERSTAND THE DATA

How to use global wildfire & heat map.

What does a flame mean?

Each flame marks a satellite pixel where NASA FIRMS detected unusual heat. The feed used here is Suomi-NPP VIIRS, with a nominal 375-metre detection resolution. A hotspot can be a wildfire, agricultural burning, industrial heat or another thermal source. It is not a confirmed incident report or a measured fire perimeter.

How current is this wildfire map?

Choose detections from the past 6, 12 or 24 hours. The page checks the feed every five minutes while open, but new detections depend on satellite overpasses and processing. Read the detection timestamp, not just the refresh time. A flame can represent an earlier observation of a fire that has since changed or gone out.

How do I inspect a hotspot?

Choose a cluster to zoom in, or select a report in the text list. Individual detections show coordinates, UTC acquisition time, confidence and radiative power where available. Cluster numbers count detected pixels; one fire can produce many detections. Confidence describes the detection, not the danger to a household.

Does the animation show fire spread?

No. Flickering flames help identify markers. Observation replay reveals when the satellite acquired detections; it does not predict spread. Cloud cover, smoke and gaps between overpasses can hide activity. Use local fire and evacuation authorities for immediate decisions.

PRACTICAL GEAR / READY WHEN YOU NEED IT

Put your plan into gear.

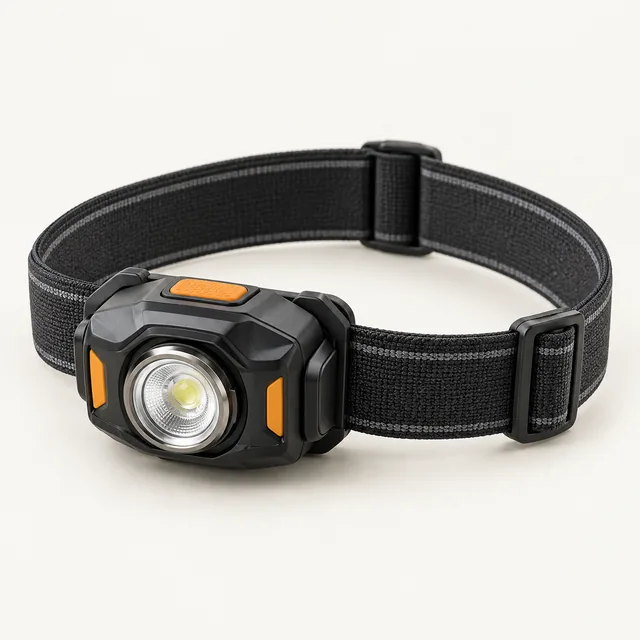
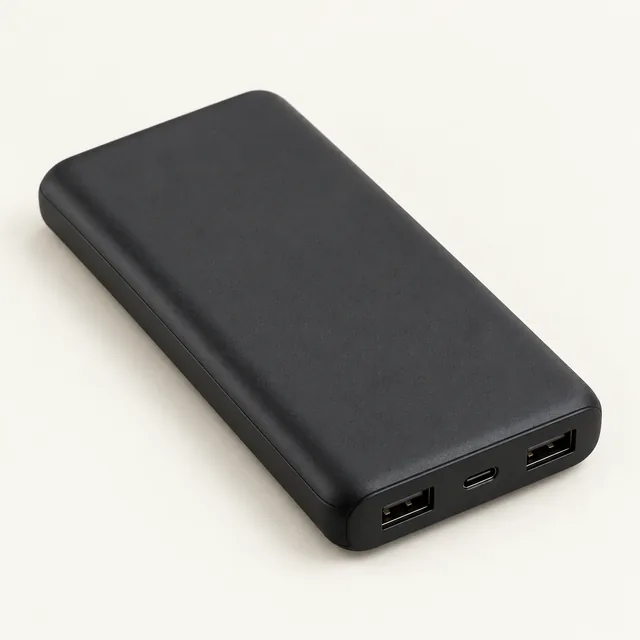
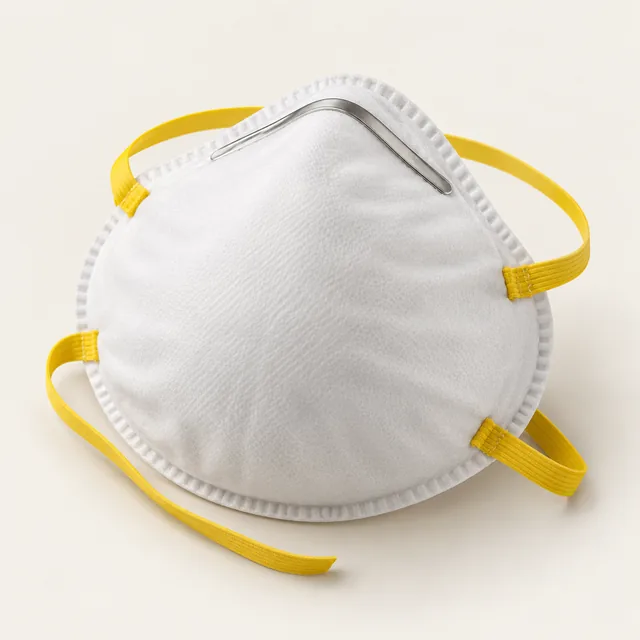
Find the right tool for the next gap in your kit. Compare the essentials below, then check current prices and options on Amazon.

Explore wildfire preparation

As an Amazon Associate I earn from qualifying purchases. We may receive a commission when you buy through these Amazon links. Illustrations show equipment types. Links open Amazon searches with varied results; compare listing photos, specifications, contents and compatibility before buying.